Is cloud spend COGS or OpEx? Make it a margin KPI
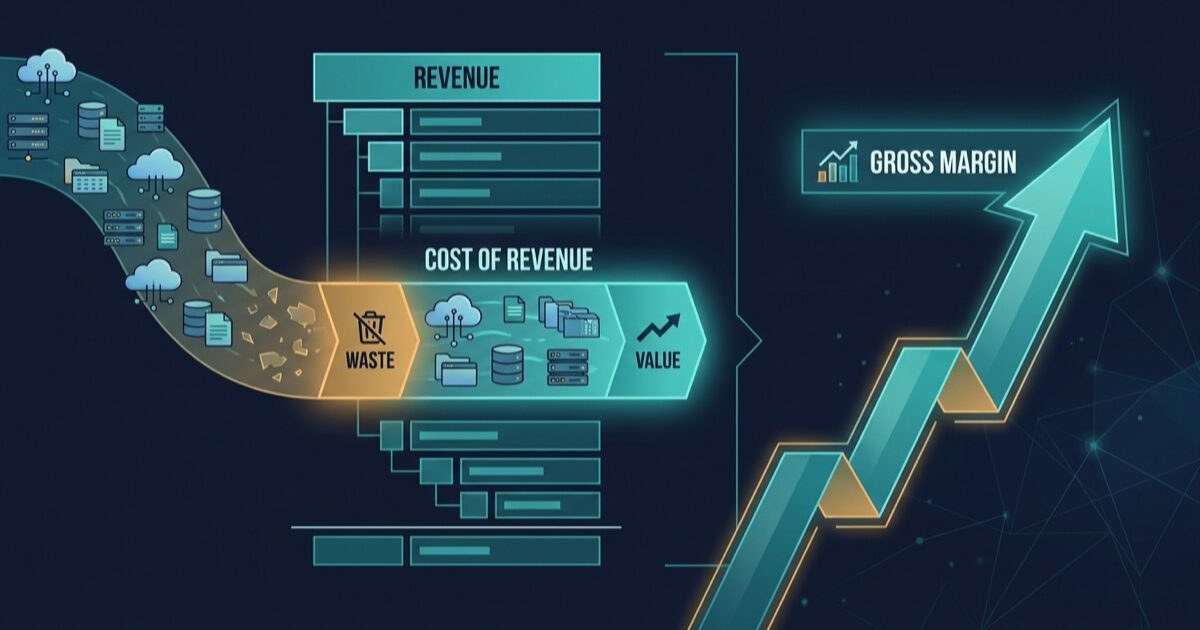
Your cloud bill does not sit in operating expenses. It sits in cost of revenue, which means every wasted dollar comes out of gross profit before anything else gets paid. Flexera's 2026 State of the Cloud report puts that waste at 29% of IaaS and PaaS spend, the first increase in five years. For a company spending 10% of revenue on infrastructure, that is roughly three points of gross margin sitting in idle resources.
Your cloud bill is COGS, and COGS is margin
Gross profit is revenue minus cost of revenue. For a software company, hosting and infrastructure land in cost of revenue, alongside customer support and third-party APIs. Cloud hosting typically runs 6% to 12% of revenue for a SaaS business, and in the set of public software companies Andreessen Horowitz studied, roughly half of all cost of goods sold traced back to cloud.
So the accounting is simple. A dollar you stop spending on an idle node is a dollar of gross profit. It shows up in the same place a dollar of new high-margin revenue would show up, and it arrives without a sales cycle attached.
This is why "we saved $40,000 last quarter" lands badly in a finance meeting. It is a true statement in the wrong units. Finance tracks margin percentages and multiples. Report in dollars and you are asking someone else to do the conversion, which usually means nobody does it.
The exchange rate between waste and new sales
Work an illustrative example. Say you run a business at $20M in annual revenue, with infrastructure at 10% of revenue and a 76% gross margin, which is close to the 2025 median across public software companies.
Your infrastructure bill is $2M a year. At the 29% industry waste rate, about $580,000 of that is doing nothing for you. Assume you recover half of it, because some waste is genuinely hard to reach. That is $290,000 a year of recovered gross profit.
Now price the same outcome in sales terms. At a 76% gross margin, new revenue contributes 76 cents of gross profit per dollar. To add $290,000 of gross profit you need about $382,000 of new annual recurring revenue.
| Path to $290K of gross profit | What it takes |
|---|---|
| Recover half of a $580K waste line | Configuration changes and a review cycle |
| Sell $382K of new ARR at 76% margin | Pipeline, sales headcount, CAC, a sales cycle |
Both rows land the same number on the same line of the P&L. Only one of them needs a quota. In this example, gross margin moves from 76.0% to about 77.5%, and it moves this quarter rather than next year.
Why finance multiplies that number
Recovered gross profit gets a multiple applied to it. When Andreessen Horowitz ran this analysis across 50 of the largest public software companies in 2021, their aggregate cloud bill was about $8B, and the firm estimated $100B of market value was being erased by what cloud spend did to margins. The multiple they used was 24 to 25 times enterprise value to gross profit.
Be honest about the date on that. Software multiples peaked around 2021 and have compressed a long way since. Substitute whatever multiple your board actually uses and the shape holds, because gross profit is the line most software valuations are built on. Every dollar you move out of cost of revenue gets multiplied by that number.
There is a second-order effect worth naming. Rule of 40 adds your growth rate to your profit margin. Waste recovery moves the margin term directly, with no growth spend required to get it. In a market that now rewards the profitable half of that equation, this is one of the few levers that moves the score without costing anything to pull.
The part most FinOps dashboards get wrong
Three failure modes turn a good cost program into a credibility problem.
Identified savings get reported as savings. Dashboards are generous with words like "potential" and "opportunity". Finance counts what changed on the invoice. When your slide says $400,000 and the bill moved $90,000, the rest of the meeting is about the gap instead of the win. Keep identified and confirmed in separate columns, permanently.
The easy wins are already gone. The FinOps Foundation's 2026 survey, covering 1,192 practitioners and more than $83B in annual cloud spend, found teams saying they have hit the "big rocks" of waste and now face a high volume of smaller items that each take real effort to capture. The remaining waste is a long tail, and a long tail does not respond to a quarterly manual review.
AI changed the denominator. In that same survey, 98% of practitioners now manage AI spend, up from 31% two years ago. AI cost behaves differently from hosting, because inference runs again on every query rather than amortizing across users. Bessemer's 2025 data on AI companies shows the fastest-growing cohort averaging around 25% gross margin, with steadier businesses closer to 60%, against the 70% to 80% that classic SaaS sustained. The margin cushion that used to quietly absorb infrastructure waste is thinner than it was.
Where the long tail actually lives
"Reduce waste" is not an instruction anyone can act on. These are the categories that make up most of it, and each one is a specific thing an engineer can go check this week.
- Storage sitting on an older, pricier tier. The same bytes at a lower price, on AWS EBS gp2 volumes and on GCP pd-ssd disks.
- Objects on the hot tier long after anyone reads them. S3 Standard-IA lists about 46% below S3 Standard, so moving cold objects with a lifecycle rule cuts the at-rest rate. The 128 KB floor and the 30-day minimum decide whether the discount survives.
- Compute that looks off but still bills. A stopped Azure VM charges full compute until it is deallocated.
- Capacity reserved and never used. Kubernetes bills for what pods request, so oversized requests inflate your node count directly.
- Networking that bills to exist. An idle NAT gateway costs about $33 a month whether traffic flows or not.
- Database objects nobody queries. Unused Postgres indexes cost storage on every replica and tax every write.
- Warehouse time spent waiting. A Snowflake warehouse burns credits while it sits idle between queries, and every resume bills a full 60 seconds however short the query turns out to be.
- Telemetry billed twice over. Datadog meters a log once to ingest it and again to index it, so the verbose sources nobody ever searches cost the same per event as the errors you page on.
None of these are exotic. That is the point. They persist because each one is individually too small to interrupt a roadmap for, and collectively large enough to show up in your gross margin.
Four KPIs that put margin on the scoreboard
These four translate cost work into the language of the finance team. Track them together.
1. Infrastructure cost as a percentage of revenue. One number, reported monthly, with a target band. Use 6% to 12% as the external reference for SaaS hosting. This is the cleanest KPI you can own, because a point removed from this number is a point added to gross margin.
2. Verified savings, measured on the invoice. Define it precisely before you report it: the bill went down, and it stayed down across a full billing cycle. Anything that has not cleared that bar is a forecast.
3. Waste rate. Wasted spend divided by total infrastructure spend. The 29% industry figure gives you an external benchmark to sit against, which makes the number legible to people who do not read your cloud console. Track the trend line rather than the absolute.
4. Gross margin contribution, in basis points. Take verified savings for the quarter, divide by revenue, and report it as basis points of gross margin. This is the one that gets quoted in the board deck, because it is already in the units the board thinks in.
The fourth KPI is the whole point. The first three are cost metrics that a cost team reports to itself. The fourth is a margin metric, and margin metrics get read by the people who set budgets.
Set the target on percentage, not on dollars
Here is the mistake that quietly kills these programs in year two.
A target like "cut $500,000 from the cloud bill" gets harder every quarter you succeed at growing. You add customers, you add load, the absolute number goes up, and your team looks like it is losing ground while actually doing fine work. The target fights the business.
A target like "hold infrastructure at 8% of revenue" scales with the company. Grow 40% and the budget grows with you. The team is measured on efficiency rather than on absolute spend, which is the thing you actually wanted to manage.
Put it on a cadence that matches how finance closes its books:
- Monthly: infrastructure cost as a percentage of revenue, and waste rate.
- Quarterly: gross margin contribution in basis points, and verified against identified savings.
- Annually: reset the percentage target, never the dollar target.
Common questions
Is cloud spend part of COGS or operating expenses?
For a software business, the infrastructure that serves your product belongs in cost of revenue, which makes it part of COGS and a direct input to gross margin. Development and internal environments usually sit in operating expenses instead. The split matters, because only the COGS portion moves your gross margin when you cut it.
How much cloud waste is normal?
Flexera's 2026 State of the Cloud report puts wasted spend at 29% of IaaS and PaaS spend, based on a survey of more than 750 cloud decision makers. That figure rose for the first time in five years, which the report attributes to AI workloads and newer services making forecasting harder.
How do I convert cloud savings into a gross margin number?
Divide the verified annual savings by annual revenue and express the result as basis points. Savings of $290,000 against $20M of revenue is 1.45% of revenue, or 145 basis points of gross margin. Use verified savings only, meaning the amount your invoice actually dropped.
What is a good gross margin for a SaaS company?
Recent benchmarks put the median software gross margin near 80%, and the median total-revenue gross margin near 76%. Companies with meaningful AI features are trending well below that as inference costs enter cost of revenue, and the fastest-growing AI cohorts in Bessemer's 2025 data average far lower still.
Should FinOps own a margin target?
Owning a margin contribution number gives the team a metric that finance already tracks, which changes the conversation from cost policing to margin ownership. Pair it with a cost-as-percentage-of-revenue target so the goal scales as the business grows.
How OhChimp approaches this
The long tail is the hard part. Chasing hundreds of small findings by hand is exactly what teams stop doing when the quarter gets busy, and that is where the 29% comes from.
OhChimp's agents scan your clouds, Kubernetes clusters, databases, and code, then turn each finding into a reviewable plan with a confidence score, a risk level, and rollback steps. You press apply, and nothing changes until you do. Once a change ships, the saving is checked against your real bill, so the number you take to finance is the number that left your invoice.
Pricing is a flat monthly fee, and we never take a cut of your savings, so the margin you recover stays on your side of the line. See what OhChimp connects to on the integrations page, and the plans on the pricing page.