Cut Datadog log costs: indexing bills 17x ingestion
Published · Updated · OhChimp Engineering
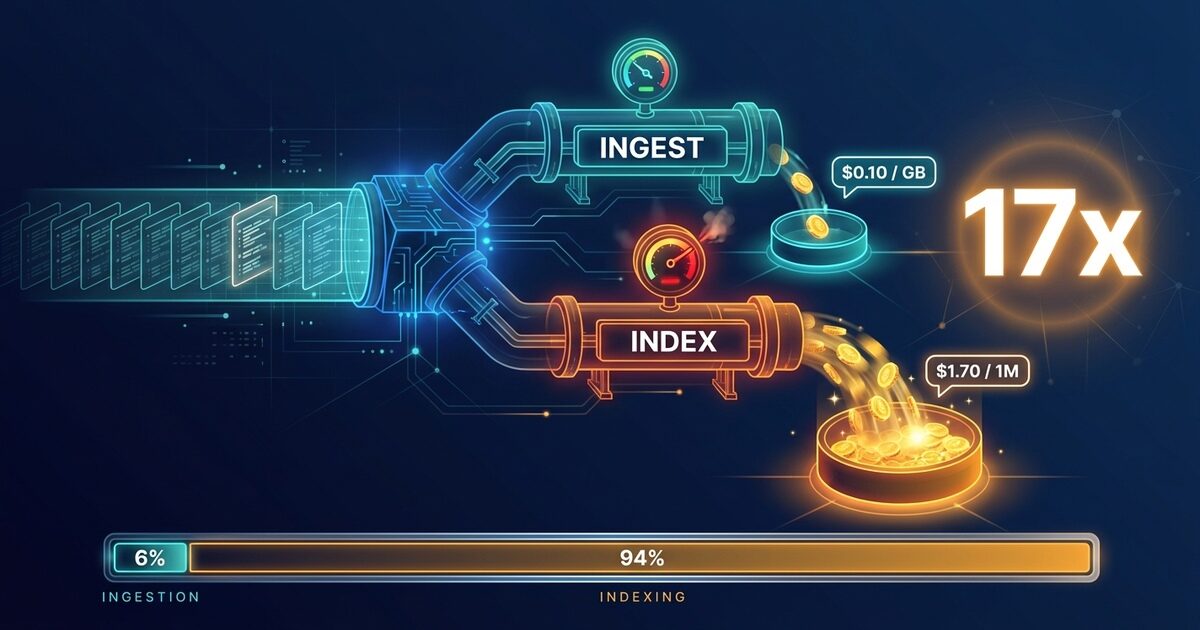
Datadog meters your logs twice. Ingestion runs $0.10 per GB. Indexing runs $1.70 per million events, and at a typical 1 KB per event those are the same million logs. So indexing the logs costs seventeen times what ingesting them costs. That premium usually lands on debug and info lines nobody has ever searched.
Why indexing costs 17x what ingestion costs
Datadog splits log billing into two meters, ingestion and indexing, priced in different units. That split is why exclusion filters can cut a Datadog log bill without dropping a single log.
Ingestion is $0.10 per uncompressed GB. It buys parsing, enrichment, tagging, Live Tail, and routing to archives. Every log you send crosses this meter exactly once.
Indexing is $1.70 per million log events at 15-day retention on an annual plan, or $2.55 on demand. Indexing is what makes a log searchable in the Log Explorer and alertable from a monitor.
Now put both meters on the same million logs. At 1 KB per event, a million events is one GB, so the same logs in the same second cost $0.10 to ingest and $1.70 to index, seventeen times the price. On an on-demand plan the gap widens to about 25x.
Here is the shape at three volumes, with every event indexed at 15 days.
| Log events per month | Ingestion at 1 KB/event | Indexing at 15 days | Total |
|---|---|---|---|
| 100M | $10 | $170 | $180 |
| 500M | $50 | $850 | $900 |
| 1B | $100 | $1,700 | $1,800 |
The ratio is fixed in every row: ingestion is 5.6% of the bill and indexing is the other 94.4%. When someone tells you to cut log volume, the volume that matters is the volume you index.
Retention length also changes the indexing bill. Datadog sells 3, 7, 15, and 30 day retention tiers for standard indexing, priced separately, and the $1.70 per million events figure is the price at 15-day retention. Dropping a chatty index from 15 days to 7 lowers the indexing bill on its own, and the change takes one field.
Every price in this post is Datadog's published Log Management list pricing as of August 2026. Recheck the dollar figures before you budget against them, because the ratios outlast the prices.
The exclusion filter that swallows the ones below it
Every guide tells you to add exclusion filters. Almost none explain how two filters interact, which is where the saving you expected never arrives.
Exclusion filters live on an index and evaluate in order, top to bottom. Datadog stops at the first active filter a log matches, so every filter below it is skipped for that log. The index configuration docs spell this out, and it is the sentence everyone skims past.
Matching is decided before sampling. A filter set to exclude 50% of status:info still matches every single status:info log, including the half it deliberately keeps. Those kept logs are finished being processed. A stricter filter further down that would have excluded 100% of them never gets a turn.
So this order does the wrong thing:
- Exclude 50% of
status:info - Exclude 100% of
service:chatty-worker status:info
Half of chatty-worker's info logs get indexed forever, and the second filter reports itself as active the whole time. Put the specific filter first and both behave as written: chatty-worker drops entirely, and everything else that is status:info gets sampled at 50%.
Ordering specific above broad is the same discipline as firewall rules, with the same failure mode when you get it backwards. Both filters still sit there looking enabled, so the only symptom is a service whose indexed volume never drops after you added a filter aimed straight at it.
What you still pay after you exclude everything
An exclusion filter takes a log out of the index, but the log still arrives and is still billed as ingestion.
Excluded logs still cross the $0.10 per GB meter, show up in Live Tail, feed log-based metrics, and land in your archives. Datadog's usage metric for ingested events counts excluded logs on purpose, which confirms that ingestion billing includes logs that never reach the index.
Ingestion cost therefore puts a floor under the bill that no exclusion filter can lift. Take a 500 million event month, and say 60% of it is debug and info chatter that has never appeared in a saved search.
| Line | Before | After excluding 60% |
|---|---|---|
| Ingestion | $50 | $50 |
| Indexing (15 days) | $850 | $340 |
| Total | $900 | $390 |
In this example the indexing cost falls 60%, from $850 to $340, exactly matching the excluded volume. The total bill falls 57%, from $900 to $390, because the $50 of ingestion does not move at all. When you report this to finance, the number to promise is 57%. Observability spend sits in the same COGS bucket as the rest of your infrastructure, so it lands on gross margin the same way an idle instance does.
If you excluded those logs because indexing them was expensive, rather than because they are worthless, Flex Logs keeps them queryable at a different price. Flex storage lists at $0.05 per million events stored per month against standard indexing's $1.70, so the same 300 million events run about $15 instead of $510. Check the tradeoffs before you commit: Flex queries are slower than standard ones, log monitors do not alert on the Flex tier, and Flex storage pricing assumes you buy Flex Compute separately (the bundled Flex Logs Starter tier lists at $0.60 per million events).
Check the monitors before the price, because that middle tradeoff decides the question on its own. A log monitor evaluating a query whose logs have moved to Flex stops firing. A monitor with nothing left to evaluate reports the same green as a monitor with nothing wrong, so the page you lose is the page you find out about during the incident it was meant to catch. Anything a monitor watches stays in a standard index, and you shorten that index's retention to take the saving instead.
Find your noisiest log sources by hand
Three calls get you there: the first sizes the problem, the second names the culprit, and the third shows what you are already excluding.
Export your credentials once. Substitute your own Datadog site if you are not on US1.
export DD_API_KEY="..."
export DD_APP_KEY="..."
export DD_SITE="datadoghq.com"   # us3.datadoghq.com, datadoghq.eu, ap1.datadoghq.com, ...
Check the permissions on the role behind that application key before you start, because the three calls below do not all need the same ones. Reading log data needs logs_read_data, and it is further restricted per index by logs_read_index_data. Writing the change in the next section needs logs_write_exclusion_filters, which is the permission that specifically covers creating and modifying exclusion filters inside an index. Creating a whole new index is a different permission again, logs_modify_indexes. A key short one of these fails at the call that needs it and not before, so it is worth two minutes up front.
Start with indexed events straight from the usage meter, split by retention tier.
curl -sG "https://api.${DD_SITE}/api/v2/usage/hourly_usage" \
  --data-urlencode "filter[timestamp][start]=2026-07-01T00:00:00+00:00" \
  --data-urlencode "filter[timestamp][end]=2026-07-31T23:00:00+00:00" \
  --data-urlencode "filter[product_families]=logs" \
  -H "DD-API-KEY: ${DD_API_KEY}" \
  -H "DD-APPLICATION-KEY: ${DD_APP_KEY}" \
  | jq '[.data[].attributes.measurements[]
         | select(.usage_type | startswith("logs_indexed_events"))]
        | group_by(.usage_type)
        | map({usage_type: .[0].usage_type, events: (map(.value // 0) | add)})'
The usage types come back named logs_indexed_events_<retention>_count, so one glance tells you whether your volume is sitting at 15 days or at 30. Datadog usage data lags real time by up to 72 hours, so pull a month that has already closed. The older /api/v1/usage/logs endpoint you will find in older write-ups is deprecated, so build anything new on the v2 call above.
Now find who is producing it. Aggregate the logs themselves and group by service.
curl -s -X POST "https://api.${DD_SITE}/api/v2/logs/analytics/aggregate" \
  -H "Content-Type: application/json" \
  -H "DD-API-KEY: ${DD_API_KEY}" \
  -H "DD-APPLICATION-KEY: ${DD_APP_KEY}" \
  -d '{
    "filter": { "query": "*", "from": "now-7d", "to": "now" },
    "compute": [{ "aggregation": "count", "type": "total" }],
    "group_by": [{
      "facet": "service",
      "limit": 20,
      "sort": { "aggregation": "count", "order": "desc" }
    }]
  }' | jq '.data.buckets[] | {service: .by.service, count: .computes.c0}'
You are looking for a shape, so you rarely need a chart. On a noisy org the top bucket comes back an order of magnitude clear of the second, something like a chatty-worker at 41 million against a runner-up at 3 million.
Swap "facet": "service" for "facet": "status" and run the same aggregation again to split the window by level. The service that dominates the count on status:debug, and appears in no saved search and no monitor, is your first exclusion filter.
Finally, read what your indexes already do.
curl -s "https://api.${DD_SITE}/api/v1/logs/config/indexes" \
  -H "DD-API-KEY: ${DD_API_KEY}" \
  -H "DD-APPLICATION-KEY: ${DD_APP_KEY}" \
  | jq '.indexes[] | {name, num_retention_days, daily_limit,
        filters: [.exclusion_filters[]? |
                  {name, is_enabled,
                   query: .filter.query, sample_rate: .filter.sample_rate}]}'
Read that filter list top to bottom, because that is the evaluation order from the section above. If a broad filter is sitting above a specific one, you have already found something to fix.
Add an exclusion filter without clobbering the index
The index update endpoint takes the index definition, and filter (the index's own query) is a required field on it. So the safe pattern is read, edit, write back. Do not hand-write a fresh body from memory.
Pull the current definition and keep a writable projection of it.
curl -s "https://api.${DD_SITE}/api/v1/logs/config/indexes/main" \
  -H "DD-API-KEY: ${DD_API_KEY}" \
  -H "DD-APPLICATION-KEY: ${DD_APP_KEY}" > index-main.raw.json

# Keep only the writable fields, and drop nulls so an index with no daily
# limit does not send daily_limit: null back to the API.
jq '{filter, num_retention_days, daily_limit, exclusion_filters}
    | with_entries(select(.value != null))' \
  index-main.raw.json > index-main.backup.json
That backup file is your rollback. Keep it until you are happy.
Now add one filter at the top of the list, ahead of anything broader.
jq '.exclusion_filters = ([{
      name: "drop chatty-worker debug",
      is_enabled: true,
      filter: { query: "service:chatty-worker status:debug", sample_rate: 1.0 }
    }] + (.exclusion_filters // []))' \
  index-main.backup.json > index-main.updated.json
sample_rate is the fraction excluded, so 1.0 drops every match and 0.5 drops half. Send it.
curl -s -X PUT "https://api.${DD_SITE}/api/v1/logs/config/indexes/main" \
  -H "Content-Type: application/json" \
  -H "DD-API-KEY: ${DD_API_KEY}" \
  -H "DD-APPLICATION-KEY: ${DD_APP_KEY}" \
  -d @index-main.updated.json | jq '.exclusion_filters'
Rolling back is the backup file and the same call.
curl -s -X PUT "https://api.${DD_SITE}/api/v1/logs/config/indexes/main" \
  -H "Content-Type: application/json" \
  -H "DD-API-KEY: ${DD_API_KEY}" \
  -H "DD-APPLICATION-KEY: ${DD_APP_KEY}" \
  -d @index-main.backup.json
Excluded logs keep flowing to Live Tail, to your log-based metrics, and to your archives, so a filter you regret costs you Explorer visibility for a while and nothing more. That makes this a low-risk change to test in production, which is rare for anything sitting on a bill this size.
One more control while you are in the index. daily_limit caps how many events the index accepts per day. Past the cap Datadog stops indexing and keeps everything else running, so Live Tail, archives, and log-based metrics carry on untouched. The counter resets at 2:00pm UTC unless you customize it, which is worth checking against your own account before you rely on a limit to catch an overnight spike. Set one as the circuit breaker for the afternoon a bad deploy starts screaming into your most expensive index.
A quick decision tree
graph TD
  A[Noisy log source] --> B{Ever searched or alerted on?}
  B -- No --> C[Exclusion filter, sample_rate 1.0, placed above broader filters]
  B -- Yes --> H{Does a log monitor alert on it?}
  H -- Yes --> I[Keep it in a standard index, shorten retention instead]
  H -- No --> D{Needed beyond 15 days?}
  D -- No --> E[Keep indexed, drop the index to 7-day retention]
  D -- Yes --> F[Route to Flex Logs, slower queries and no log monitors]
  C --> G[Ingestion still bills. Set a daily_limit as the backstop]
Common questions
Do exclusion filters reduce my Datadog ingestion cost?
No. Exclusion filters do not reduce Datadog ingestion cost. An exclusion filter removes a log from the index only, and that log is still ingested and still billed at $0.10 per GB. Excluded logs also stay available in Live Tail, in your archives, and to log-based metrics. In a 500 million event month, excluding 60% of the volume cuts indexing spend from $850 to $340 while ingestion spend stays at $50.
Why is my Datadog log bill so high when ingestion is only $0.10 a GB?
Datadog log bills run high because indexing is metered separately from ingestion, at $1.70 per million events at 15-day retention on an annual plan, or $2.55 on demand. At a typical 1 KB per event, a million events equal one GB, so indexing costs about seventeen times what ingesting the same logs costs. Where every event is indexed, indexing is about 94% of the log bill and ingestion is the remaining 6%.
In what order do Datadog exclusion filters run?
Datadog exclusion filters run top to bottom, and the first active filter a log matches is the only filter that processes that log. Matching is decided before sampling, so a filter set to exclude 50% of a query still claims every log matching that query, including the half the filter keeps. A stricter filter placed below that 50% filter never evaluates the logs it would have excluded. Put specific filters above broad ones.
What is the difference between Flex Logs and standard indexing?
Flex Logs and standard indexing differ in price and access speed. Standard indexing lists at $1.70 per million events at 15-day retention and gives you fast search plus log monitors. Flex Logs storage lists at $0.05 per million events stored per month, with slower queries and no log monitor alerting on the Flex tier. Flex storage pricing also assumes you buy Flex Compute separately, while the bundled Flex Logs Starter tier lists at $0.60 per million events.
How do I find which service is driving my indexed log volume?
Aggregate your logs by service. POST to /api/v2/logs/analytics/aggregate with a count compute and a group_by on the service facet sorted descending, then run the same aggregation again on the status facet to split by level. Cross-check the service totals against /api/v2/usage/hourly_usage filtered to the logs product family, and remember that Datadog usage data lags by up to 72 hours.
Can I roll back an exclusion filter?
Yes, rolling back a Datadog exclusion filter is cheap. Save the index definition before you edit it, then PUT the saved copy back when you want the old behavior. You can also flip is_enabled to false on a single filter and leave the other filters alone. Excluded logs were never deleted, so if you have archives configured, the logs dropped while the filter was live can still be rehydrated. Rehydration is the one part that is not free: it creates fresh indexed events and bills at the indexing rate, so treat it as an incident tool rather than a routine undo.
Does dropping Datadog retention from 15 days to 7 save money?
Yes, dropping retention from 15 days to 7 days saves money, and the change is one field on the index rather than a change to what your services emit. Datadog prices indexing per retention tier, so a shorter tier costs less per million events indexed. Shortening retention is the right first move for an index that gets searched constantly during incidents and rarely gets searched a week later. The same reasoning applies to any usage-metered tool, such as idle Snowflake warehouses billing credits between queries.
How OhChimp approaches this
Log volume climbs one chatty deploy at a time. Append a filter for the new service and the broad one you wrote last quarter matches those logs first, so the filter you just added never gets a turn. You find out at invoice time.
OhChimp reads your Datadog usage summary across products, flags when indexed log events run high for the month, and queries the specific noisy source behind the number rather than handing you an aggregate. The fix arrives as a plan you read first, with the exclusion filters and sampling written out. Each plan carries a confidence score and a risk level, and the rollback steps sit beside them. Nothing moves in your indexes until you press apply. Once the filters are live, OhChimp checks the saving against your real Datadog invoice before it counts.
The Datadog integration page covers connecting the account.